
We build software everyday using the latest best practices. Decades of process improvements - that we are re-using as if they were obvious - have enabled us to ship code faster and with less risk. Let's pause and think about even semi-recent trends in DevOps:
- reviewing code using a peer-like review process, to catch bugs and build common knowldege
- executing CI jobs automatically to prevent regressions
- continuous integration, which reduces the time it takes for code to go to production
- codified approaches to incident response, to minimize downtime
In the meantime, in other fields such as manufacturing and order processing, manual processes are constantly being refactored and automated to serve customers faster and cheaper. In the past 20 years, a set of algorithms and techniques under the name of Process Mining have been developed to accomplish this constant optimization.
This got me curious: could we apply these algorithms to DevOps processes to identify bottlenecks and improve the developer experience?
What is Process Mining?
In short, process mining is distributed tracing for the real world. Let's look at an example:
| Case ID | Action | Timestamp | Properties |
|---|---|---|---|
| 1 | Opened Support Case | 2022-06-01 16:43:32 | {"actor": "alice"} |
| 1 | Closed Support Case | 2022-06-02 12:32:32 | {"actor": "alice"} |
| 2 | Started Order | 2022-07-01 08:22:32 | {"actor": "bob"} |
| ... | ... | ... | ... |
As you can see, the inputs of process mining are very simple: it deals with events performed at a certain timestamp, grouped by a notion of case, which would be called a trace in the distributed tracing world. Usually, cases are performed by people and are repeated over many instances. You can add arbitrary properties such as who performed the action, etc.
The goal of process mining is to study the performance, frequency and other characteristics of real-world processes. Usually, the ultimate goal is to make a process run faster / cheaper, using some sort of automation or by re-ordering the process steps.
Why does it have to do with DevOps?
First, the world of DevOps is full of events: creating tickets, opening PRs, sending comments, running CI/CD jobs, deploying and rolling back, opening and closing incidents - the list goes on. These events are also fairly easy to access because of the high level of instrumentation provided by most dev tools. Finally, automation of manual processes is at the core of many DevOps activities. This makes the field an interesting candidate for applying process mining.
What if we could map DevOps activities to detect bottlenecks and automate manual steps?
In the rest of this article, we will apply process mining techniques to a typical development flow to try and do just that. We will provide an example dataset - you only need some level of familiarity with Python.
A study of a typical DevOps process
Note: all the code examples in this article are grouped together in the following Google Colab notebook. We highly recommend running it to follow the article steps
The dataset
We are looking at a dataset of pull request - related events, comprising close to 2,000 PRs. The data has been extracted from systems such as Github, CircleCI and Kubernetes. The following events are used, and they are all keyed on the pr_id provided by Github:
opened- when the PR first gets openedreviewComment- when a PR receives comments. To keep things easier to interpret, we have sessionized comments that appeared within 10 minute - windows as a single, coarser-grained commenting event.reviewApproval- when the PR receives an approvalforcePushed- when the PR gets updated with a new commit, usually in response to comments (the workflow is to squash and push new changes)ciStarted- when a CI job starts on the PRciEnded- when a CI job endsmerged- when the PR gets merged to the main branchdeployed- when the PR gets deployed as part of a deployment batch (note: only a subset of PRs have this event recorded in this particular dataset)
Apart from opened, merged and deployed, all the events can happen multiple times, potentially creating loops and thus reflecting real-world interactions between authors and reviewers. Here is an example of a simple trace:
| pr_id | timestamp | action |
|---|---|---|
| MDExOlB1bGxSZX... | 2019-11-12 17:58:53+00:00 | opened |
| MDExOlB1bGxSZX... | 2019-11-12 18:00:54+00:00 | reviewComment |
| MDExOlB1bGxSZX... | 2019-11-12 18:06:11+00:00 | reviewApproval |
| MDExOlB1bGxSZX... | 2019-11-12 19:03:26+00:00 | forcePushed |
| MDExOlB1bGxSZX... | 2019-11-12 19:07:13+00:00 | merged |
We can see that the PR completed in about an hour, with a fairly linear story and a pre-emptive approval (likely a very small fix to add before merging)
Using PM4PY
We will use the PM4PY library to run our explorations. It contains a set of common algorithms used in process mining.
First, we need to load our CSV file and turn into a format that PM4PY can work with. The main transformation happening here is renaming columns.
# Install required dependencies
!pip install pm4py
import pm4py
import pandas as pd
from pm4py.objects.conversion.log import converter as log_converter
# Load CSV from Github
csv = 'https://gist.githubusercontent.com/antoine-okay/9aeafcfa035539774db049e3d3f4dde0/raw/5f4169ead1d53532406b5a0e6700332e484305b3/pr_events.csv'
dataframe = pd.read_csv(csv, sep=',')
# Format column names
dataframe = pm4py.format_dataframe(dataframe, case_id='pr_id', activity_key='action', timestamp_key='event_ts')
dataframe['time:timestamp'] = pd.to_datetime(dataframe['time:timestamp'])
event_log = log_converter.apply(dataframe)
Since we are dealing with real-world processes, with the potential for noise and incomplete traces, we will also make sure that we constrain the start and end states by relying on our domain knowledge - making sure that opened is the only start event and that merged/deployed are the end events.
# Constrain to stable start/end actions
filtered_log = pm4py.filter_start_activities(event_log, ["opened"])
filtered_log = pm4py.filter_end_activities(filtered_log, ['merged', 'deployed'])
Initial exploration
First, let's get an idea of the overall lead time of this process - meaning the total time it takes to go from opening to closing a PR.
# Let's get an idea of overall duration
import numpy as np
import humanize
all_case_durations = pm4py.get_all_case_durations(filtered_log)
print('Average Lead Time: %s' % humanize.precisedelta(np.mean(all_case_durations)))
print('Median Lead Time: %s' % humanize.precisedelta(np.median(all_case_durations)))
The average and median lead time are respectively 1 day 4 hours and 5 hours
This gives us an important reference, as we try to optimize the process in the following sections.
Now, let's see what our PR process looks like in practice. We will use the simplest algorithm, known as Directly Follows Graph (DFG), which links 2 steps together whenever one directly follows the other. Since it shows every single path, it is a pretty noisy representation, but it has the core advantage of being very simple to understand and thus to derive actionable information from.
# First check of the process graph
from pm4py.algo.discovery.dfg import algorithm as dfg_discovery
from pm4py.visualization.dfg import visualizer as dfg_visualization
dfg, s, e = pm4py.discover_dfg(filtered_log)
pm4py.view_dfg(dfg, s, e)
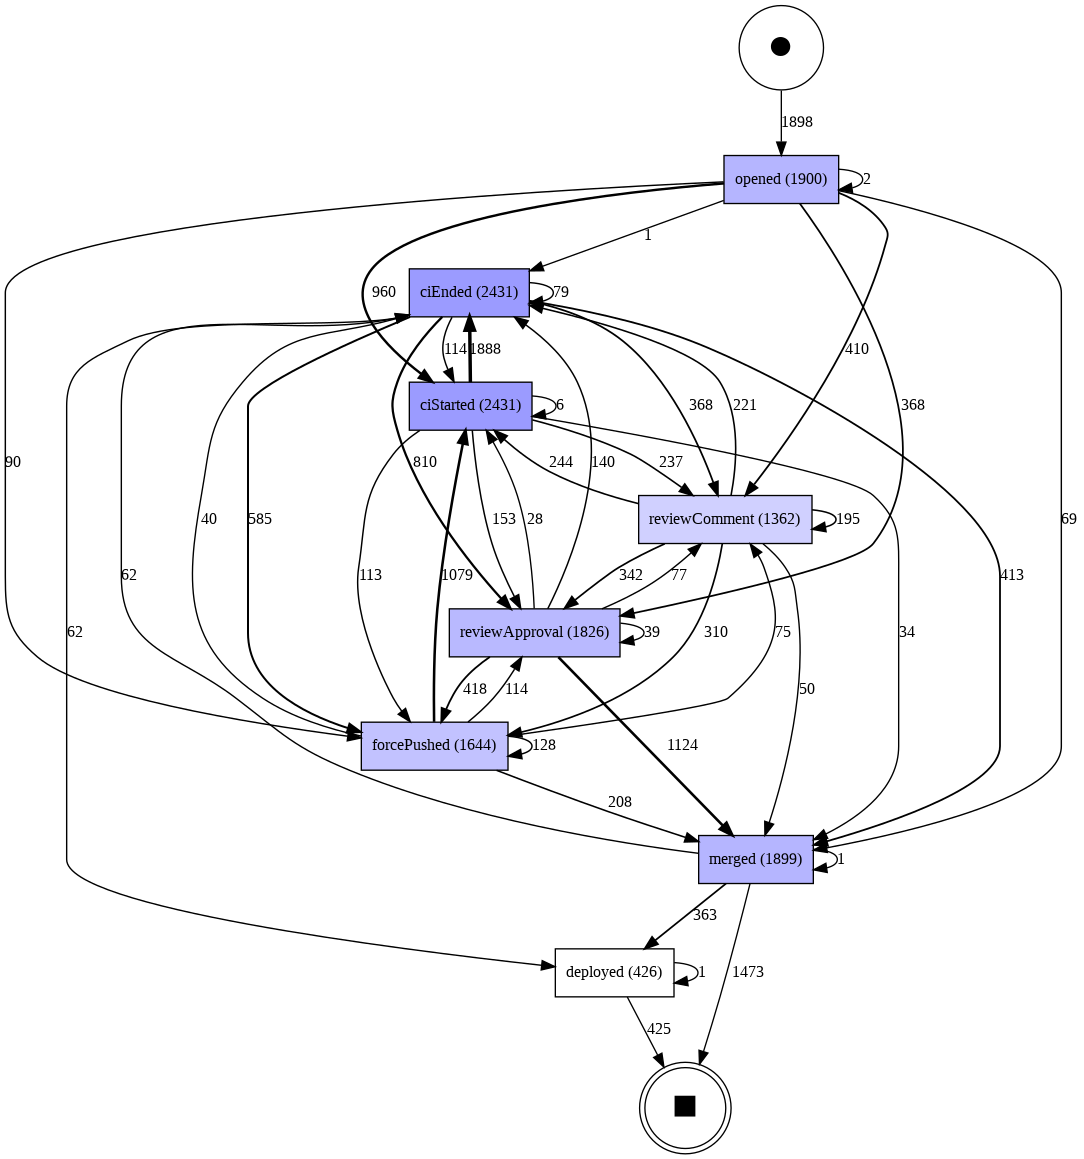
As you can see, there is a lot going on here, since we display every single path taken in the dataset. That said, we can already identify patterns:
- right after a PR gets opened, the most common next step is that a CI job starts, but the next step can also be commenting, which indicates that the 2 activities can happen concurrently.
- 368 PRs got approved with no particular comments
- we can see several "repeated work" loops with commenting, CI, and pushing new commits, reflecting the iterative nature of the review process.
- commenting is usually followed by approvals or by another commit
The field of process mining has come up with very advanced algorithms that are much better at dealing with noise (ie infrequent paths in the process) and concurrent activities. The most advanced one is called Inductive Miner, let's apply it.
# Focus on the 10 most frequent path variants
filtered_log_top_k = pm4py.filter_variants_top_k(filtered_log, 10)
# Apply inductive mining with high noise threshold
tree = pm4py.discover_process_tree_inductive(filtered_log_top_k, 0.8)
pm4py.view_process_tree(tree)

The algorithm has correctly discovered our process: a sequence from opened to deployed - you can even see the and operators highlighting the fact that CI and reviewing activities are happening concurrently.
Finding actionable data
Remembering our goal of finding process improvements, we need to find a more actionable path between these 2 extreme representations. We also want to understand how long each step is taking. We'll start from the DFG, since it is easier to interpret.
# Discover frequency-based and performance-based DFGs
dfg, s, e = pm4py.discover_dfg(filtered_log)
performance_dfg, start_activities, end_activities = pm4py.discover_performance_dfg(filtered_log)
removal_list = []
# Remove infrequent paths
for e in dfg.items():
  if (e[1]<250):
    removal_list.append(e[0])
for edge in removal_list:
    if edge in performance_dfg:
        del performance_dfg[edge]
pm4py.view_performance_dfg(performance_dfg, start_activities, end_activities, aggregation_measure='sum')
What did we do here ?
- We removed infrequent transitions in the graph (less than 250 occurrences)
- We computed the DFG but instead of labeling it with frequency, we labeled it with the time between steps.
You can play with various aggregation measures; we chose the mean and the sum to help us derive useful actions. The sum is very useful because it aggregates both the duration and the frequency signals, giving us a good idea of how costly a path is.
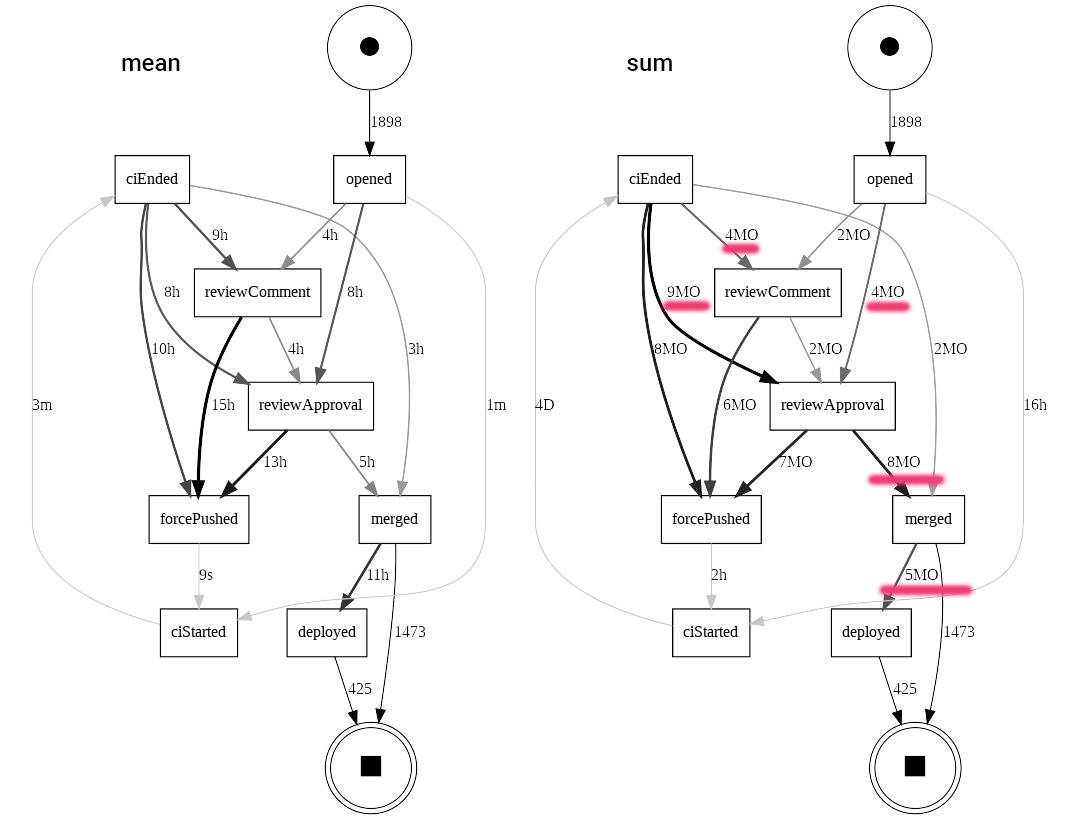
Learnings: process structure
In terms of the structure of the process, we now have a much easier time understanding common paths.
We can more clearly see the loop from reviewComment .. forcePushed .. ciStarted .. ciEnded .. reviewComment, which reflects the interaction between reviewers and authors pushing new changes. The overall story of the process remains un-affected and is in line with what we discovered in previous sections.
Learnings: CI
We see that CI takes 3 min on average and consumes 4 days total. There is not much to optimize here, and CI is likely not a bottleneck. Although CI runs in parallel to other activities, this parallelism is more of a nice-to-have.
We won't bring any change to CI.
Learnings: Lack of Continuous Deployment
Looking at the more costly paths, I highlighted the reviewApproval .. merged and the merged .. deployed paths, consuming a total of 13 months (or a mean time of 16h). This seems really high relative to other steps in this process and relative to the overall lead time. Using our domain knowledge, we know that reviewApproval is all that's needed to allow merging and deploying.
This is a clear opportunity for automation through continuous deployment. We should look into automating merging and deploying once an approval has been secured.
Learnings: Better handoffs
We see several costly paths following key steps of the process.
Some costly paths don't call for any particular actions: anything preceding a forcePushed event likely means that the author is working on a new patch. There is nothing special to improve on from a process standpoint: writing good code takes time!
However, other paths could be optimized:
- after opening or CI ending, it takes respectively 4h and 9h on average to see commenting activity
- it takes 8h between opening and approval, even without comments
- even when approval immediately follows commenting, it can take 4 hours to reach that approval
This likely means that the team could benefit from building notifications around the key handoffs between authors and reviewers. In particular, it seems that authors have to wait too long on reviewers to give them the first feedback on their PR.
While we cannot see exactly what happens between commenting and new commits, there is likely another handoff delay captured by that 15h average time, when a reviewer has answered but the author has not seen the comments yet.
Going further
We have scratched the surface of what is possible when applying process mining to DevOps. Here are some ideas to take this even further, both for this process and for the broader field of DevOps.
As an exercise to the reader:
- take business hours and weekends into account (supported by PM4PY out of the box)
- select only the longest-running processes and compare to the expected normal process - are there other bottlenecks that we haven't seen, like problematic CI jobs ?
- add better instrumentation for author / reviewers handoffs
- add properties to each process instance (repository, programming language, service, etc.) to see if they drive any slow-downs or process differences
As an extension to this study, we could look into other DevOps processes:
- how fast do we handle customer-reported bugs ?
- how efficient is the incident reponse process in terms of its impact on time to resolution ?
- what causes issue tickets or PRs to become stale ?
We hope that you enjoyed this article! Feel free to contact us to see how we could help with engineering analytics and reporting for your team. If you're curious for more, read our handbook or take a tour. We'd love to help.