Okay acquired by Stripe to boost company's engineering effectiveness
- San Francisco
- May 31, 2023
We are excited to announce that we've been acquired by Stripe, a global technology company that builds economic infrastructure for the internet! Stripe will leverage Okay's technology and expertise to continue building a world-class developer experience for their engineering team.
Since starting Okay 3 years ago, we have developed a unique approach to engineering effectiveness and software analytics: one that is team-based and focused on identifying the bottlenecks affecting engineers’ day-to-day activities, as opposed to measuring lines of code or other output metrics. As every company becomes tech-enabled, investing in engineering effectiveness and developer experience is of key importance not only to attract top talent and keep them, but also to bring a better product to end users.
Over the years, we have proven our method with thousands of engineers and at many Silicon Valley unicorns. Now, we’ll be bringing this approach to the Stripe eng team. Our values and philosophy on engineering effectiveness are a great match with Stripe, which is why we could not be more excited to join forces!
We are immensely grateful to our customers, employees and investors. Thanks for believing in us and helping us advance the state of engineering effectiveness!
- Antoine Boulanger and Tomas Barreto, Co-Founders
Okay brings all your engineering data in one place
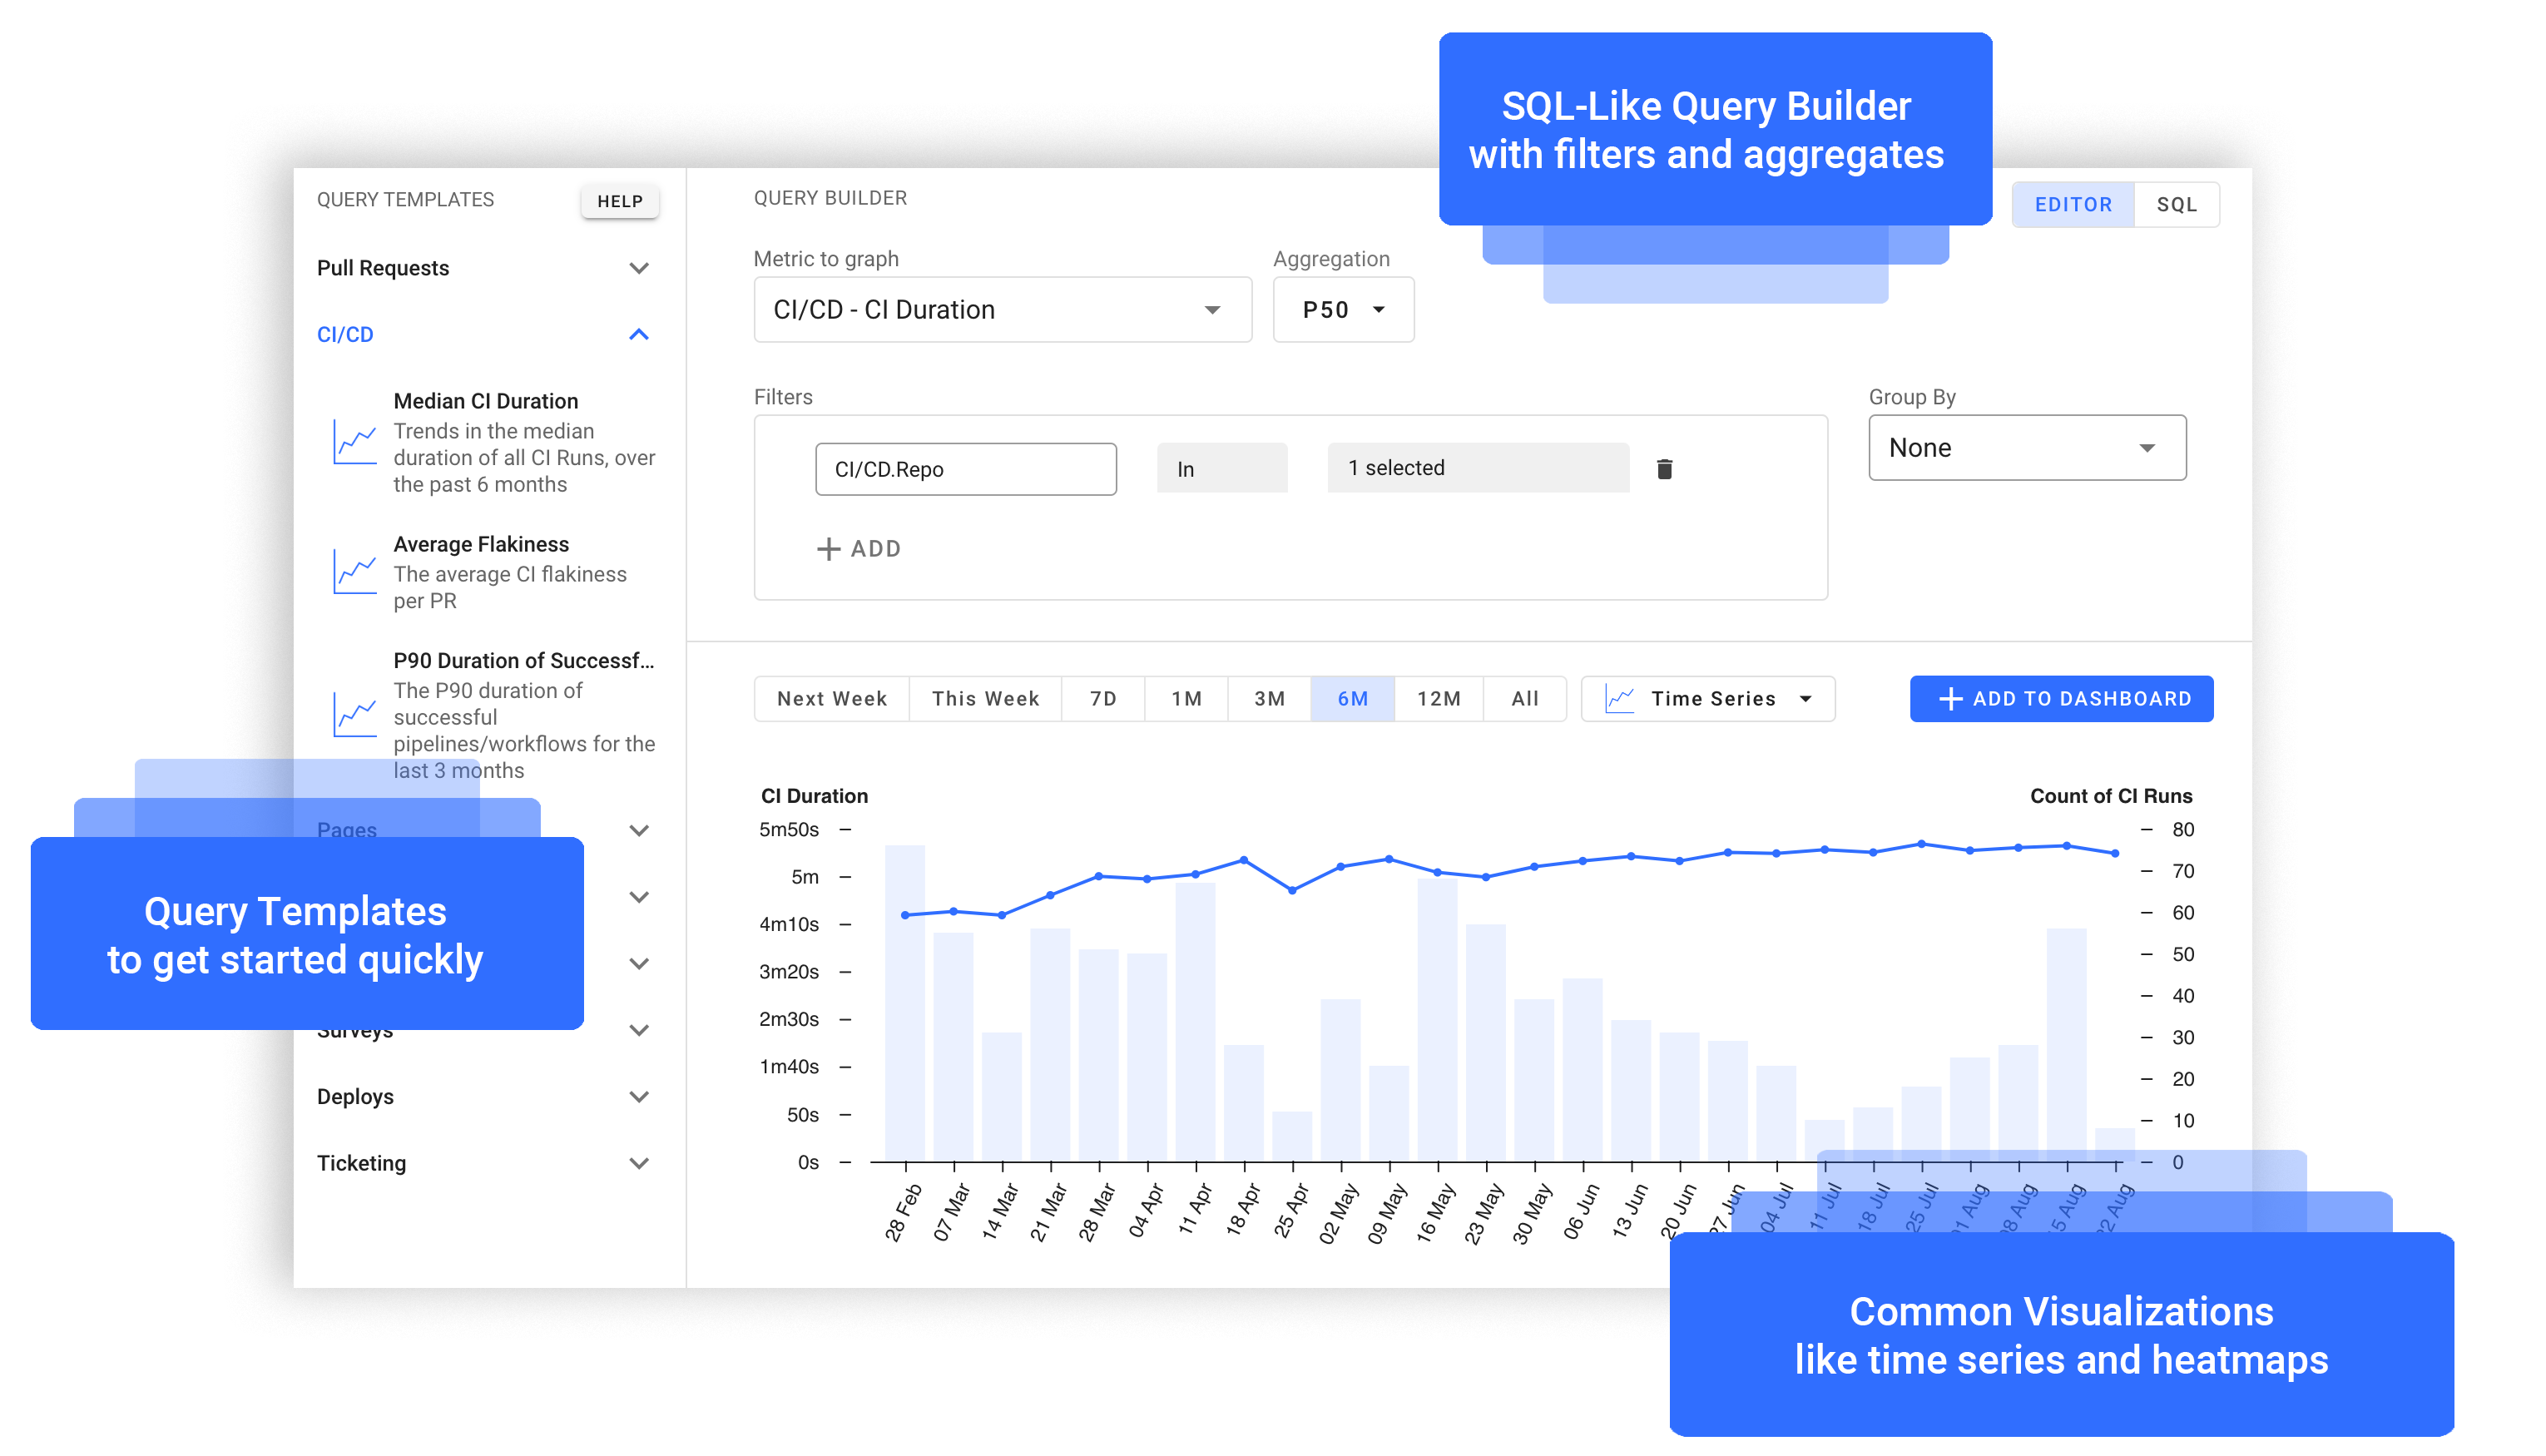
What you can do with Okay
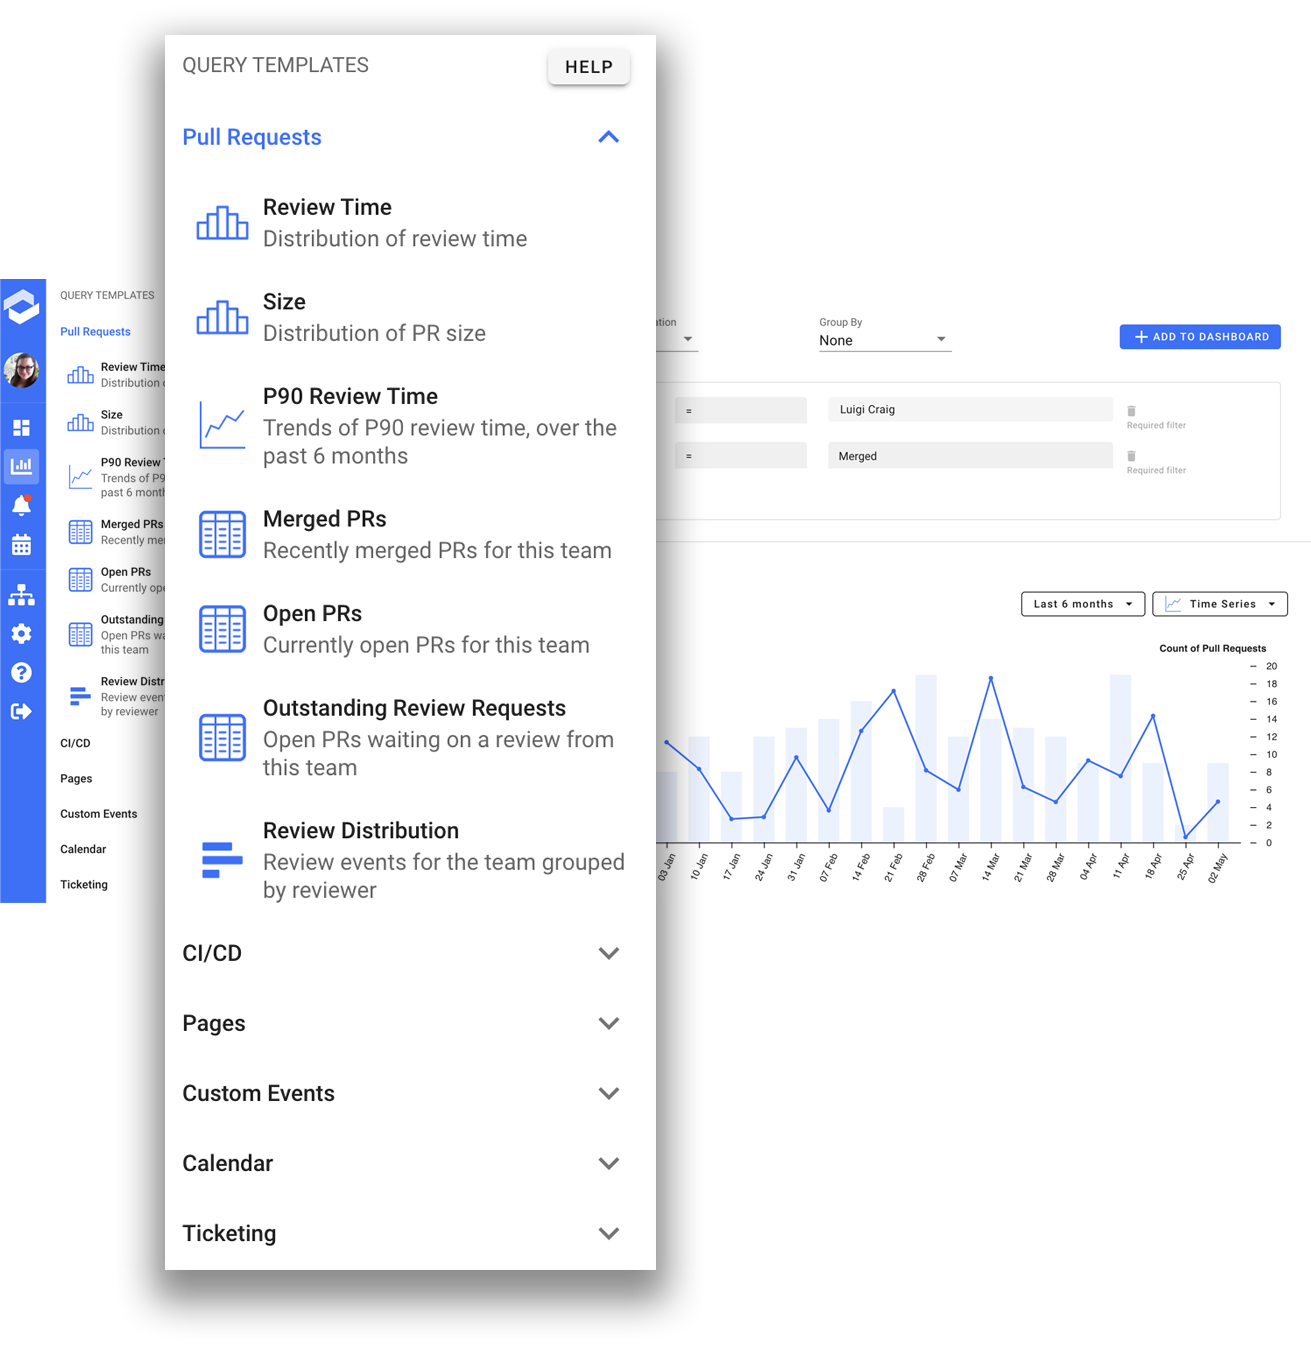
Customize dozens of presets
Okay comes packed with pre-made dashboards and queries, such as:
- DORA Metrics (lead time, deploy frequency, MTTR, change failure rate)
- Incidents dashboards
- Developer experience metrics, like meeting / interview load and oncall load
Our Query Builder enables you to tweak each query with many filters and groupings, such as team, repository or timezone
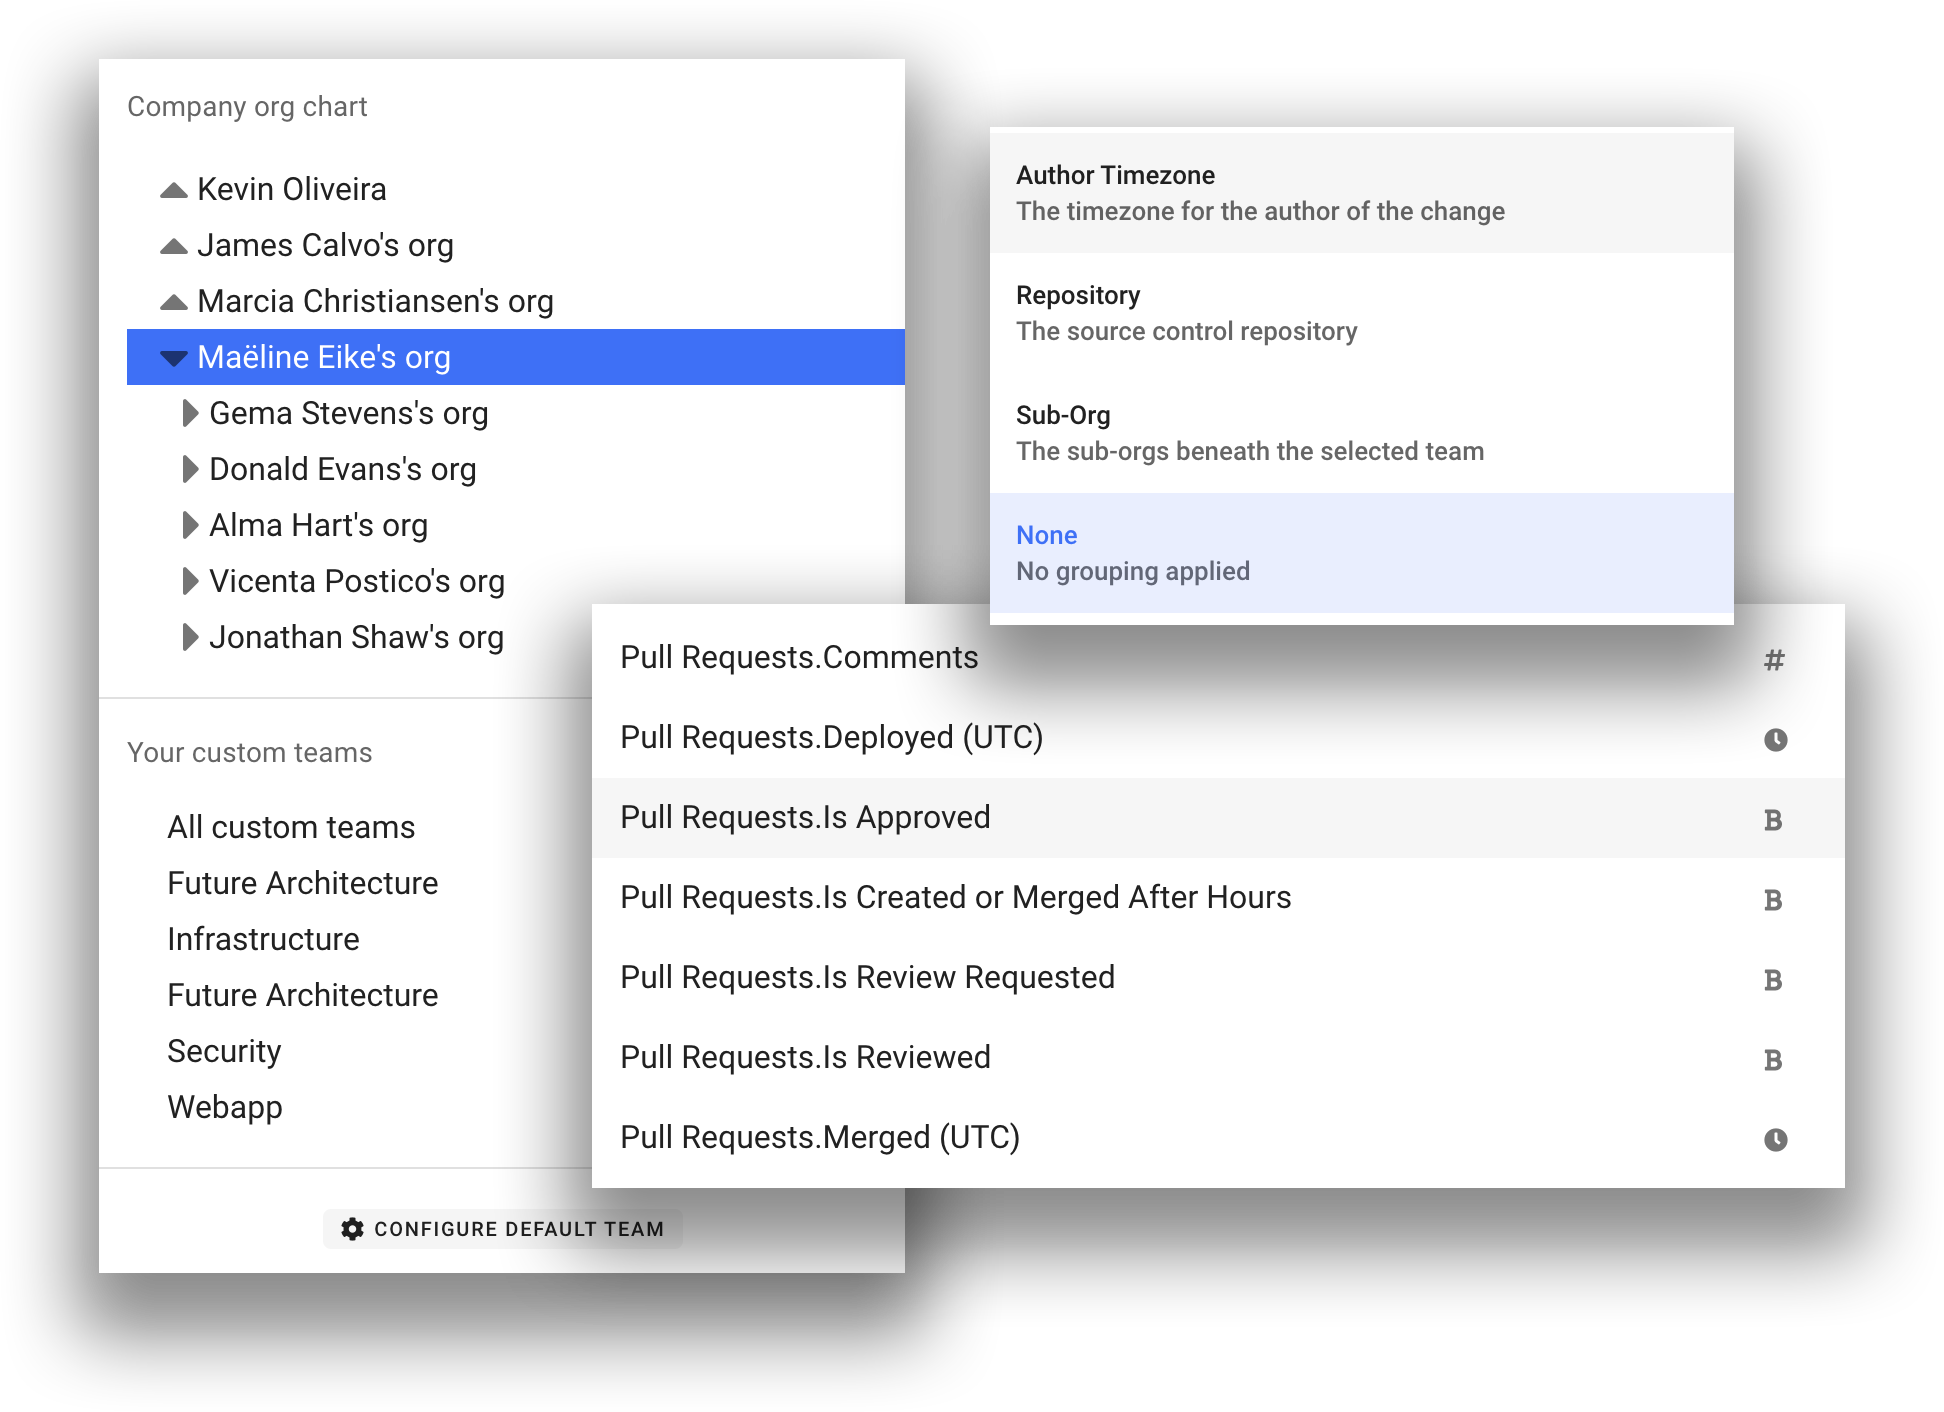
Keep everything connected
Okay gives you a fully connected data model:
- Visualize metrics by departments, teams and horizontal teams by leveraging our HR Platforms and Github Teams integrations
- Blend non-obvious dimensions such as timezones and tenures to answer very specific questions
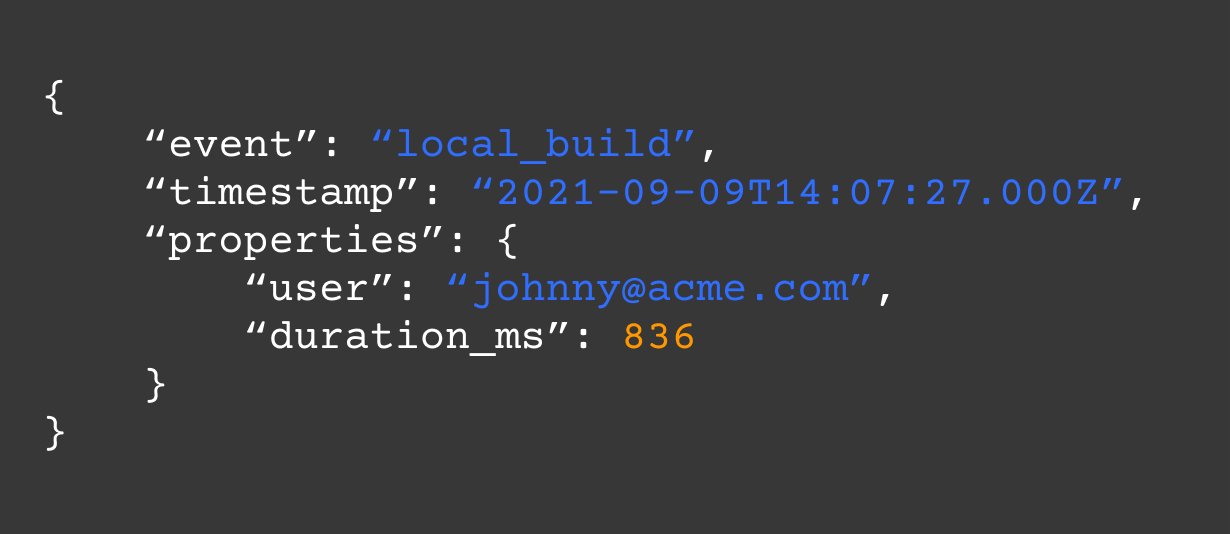
Bring your own data
Combine events coming from version control or calendars with your own custom events to paint a full picture of your activities. For example:
- Ensure that DORA metrics such as lead time actually reflect how your team work
- Analyze how fast your local environments really are, before engineers get frustrated with bad tooling
- Measure adoption of new technologies and how they impact velocity